Rob Kravec

Incoming Quantitative Trader at IMC
M.S. in Statistics, Duke
B.S. in Chemical Engineering, Stanford
3 years of full-time work experience with McKinsey and Capital One
View My Resume
View My LinkedIn Profile
View My Github Profile
Data Science Portfolio
Animated Plots with NFL Tracking Data (Shiny app)
Shiny app that generates animations of NFL passing plays from the 2018 season, using a custom-built theme. Inspired by NFL Big Data Bowl 2021 on Kaggle.
Those interested in producing their own American football plots can check-out my
ggfootball package in R. To install, simply
use the following command: devtools::install_github("robkravec/ggfootball")
Python Implementation of t-SNE
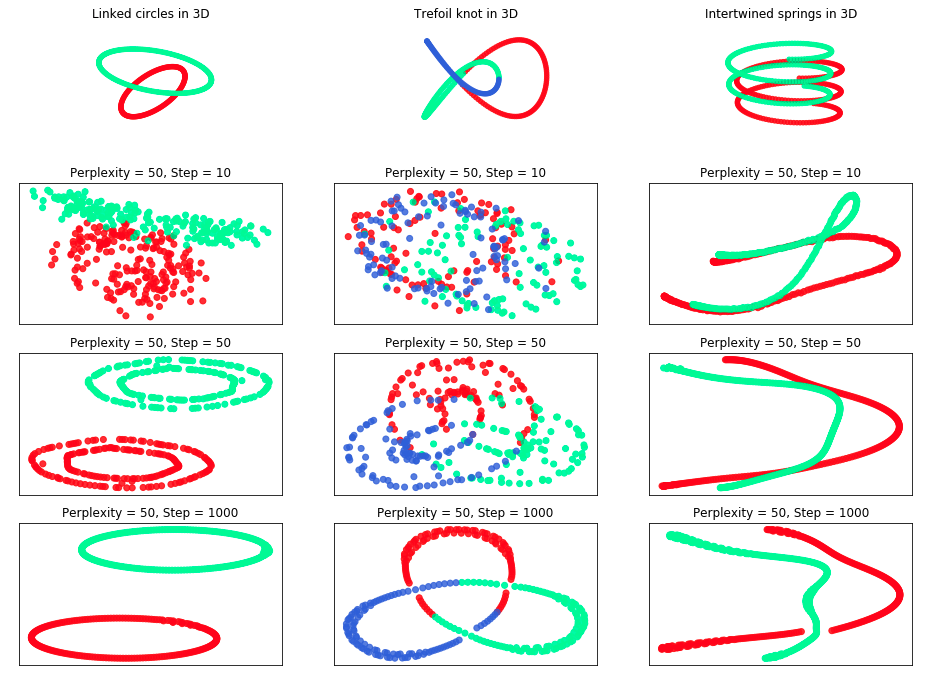
Python implementation of t-stochastic neighbor embedding (t-SNE) based on van der Maaten and Hinton’s 2008 paper, “Visualizing Data using t-SNE”. The linked
repository contains a reproducible report that discusses the t-SNE algorithm in depth (including optimization opportunities) and demonstrates results on both simulated and real datasets. This homebrewed t-SNE implementation can also be downloaded using the setup.py file provided in the repository.
Predicting Coupon Acceptance Using Machine Learning Algorithms
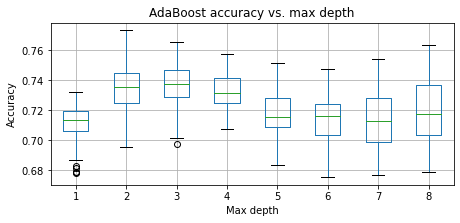
Portfolio project for Duke’s M.S. in Statistical Science program, showcasing skills in (1) exploratory data analysis, (2) algorithm selection and fitting, (3) hyperparamter tuning, (4) model interpretation, and (5) general critical thinking and problem-solving.
Selected machine learning algorithms include Support Vector Machines (SVM), Random Forest, AdaBoost, and XGBoost.
Standard Error Estimation for Clustered Data
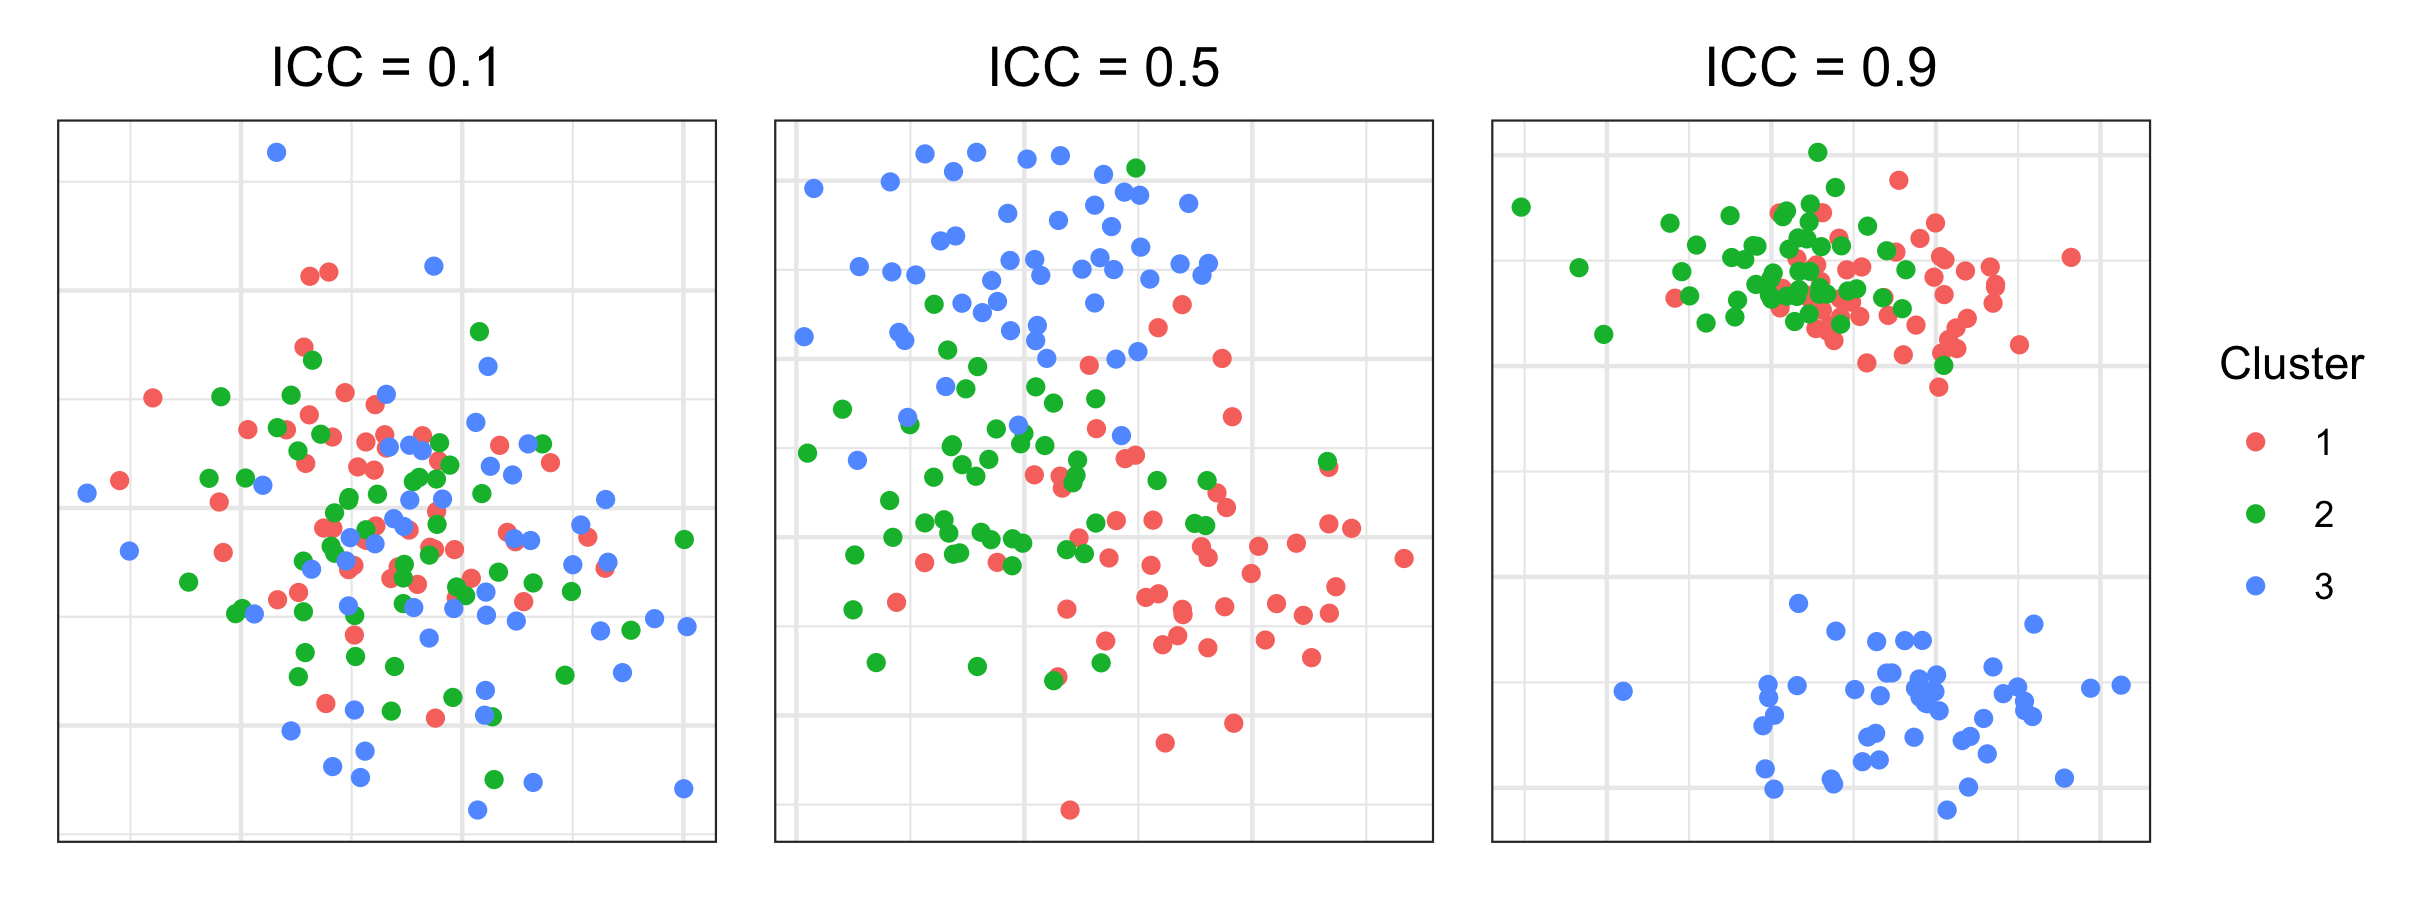
Analysis of bootstrap-based methods for standard error estimation on clustered data. This project includes a literature review, simulation studies, and a real-world case study, all demonstrating that the standard bootstrap exhibits significant downward bias in standard error estimation for data with non-zero intraclass correlation.
Hierachical Modeling Demo
Educational tool to demonstrate principles of hierarchical modeling based on an analysis of Major League Baseball (MLB) data. When the results do not turn out exactly as planned, I discuss potential causes, perform model diagnostics, and investigate the impact of sample size
Algorithms Mini Projects

Collection of five mini projects completed as part of Duke’s “Topics in Algorithms” course (ECE 590 / MATH 560) taught by Professor Eric Autry. Algorithms include (1) sorting (Selection, Insertion, Bubble, Merge, Quick), (2) depth-first and breadth-first search, (3) Bellman-Ford, (4) Edit Distance, (5) Traveling Salesman approximation using minimum spanning trees and depth-first search.
Atlanta Braves Statcast Data Exploration
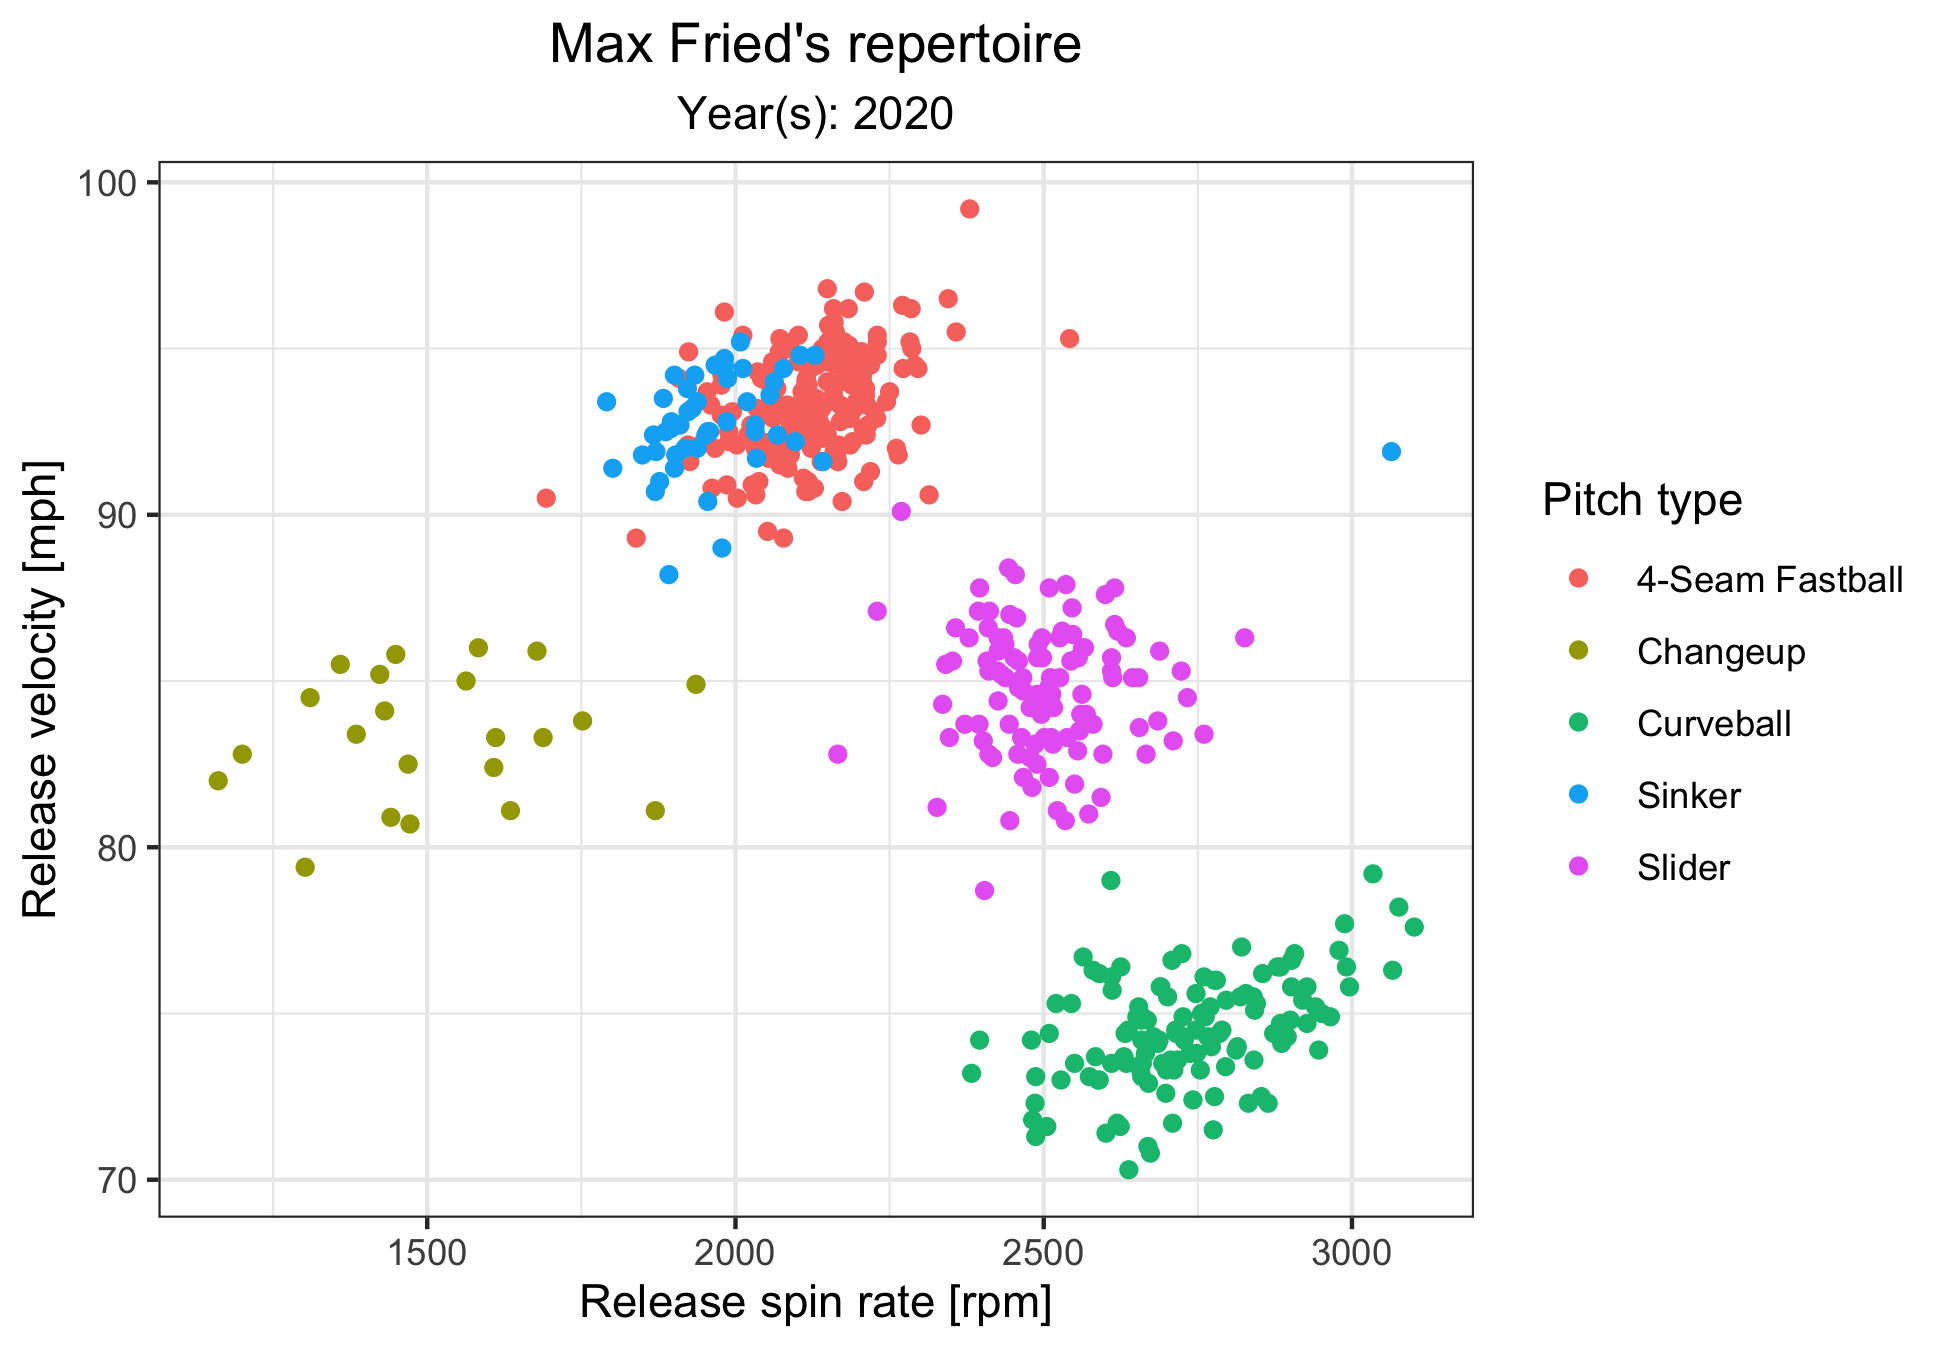
Exploration of 2017-2020 Atlanta Braves Statcast data (pitchers only). Sub-projects include:
- Pitch classification using gradient boosted tree model (XGBoost)
- Interactive plots of pitch movement using ggiraph package
- Evolution of Atlanta Braves pitching staff over time, stitched together with patchwork package
- Comparison of actual ball / strike calls to an “objective strike zone”
Economic Impact of COVID-19 (Duke Datathon 2020)
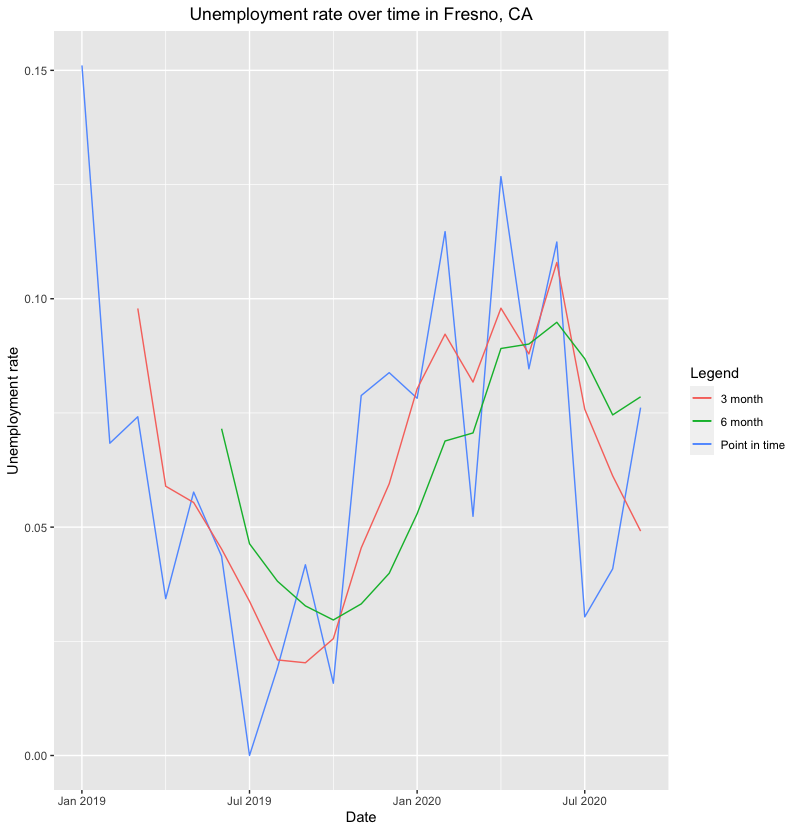
Winning submission from Duke 2020 Datathon, which challenged entrants to understand and forecast local-level economic impacts of COVID-19. I specifically worked with unemployment data from the Central Population Survey and highlight this analysis in the linked repository
Top News Headlines (Shiny App)
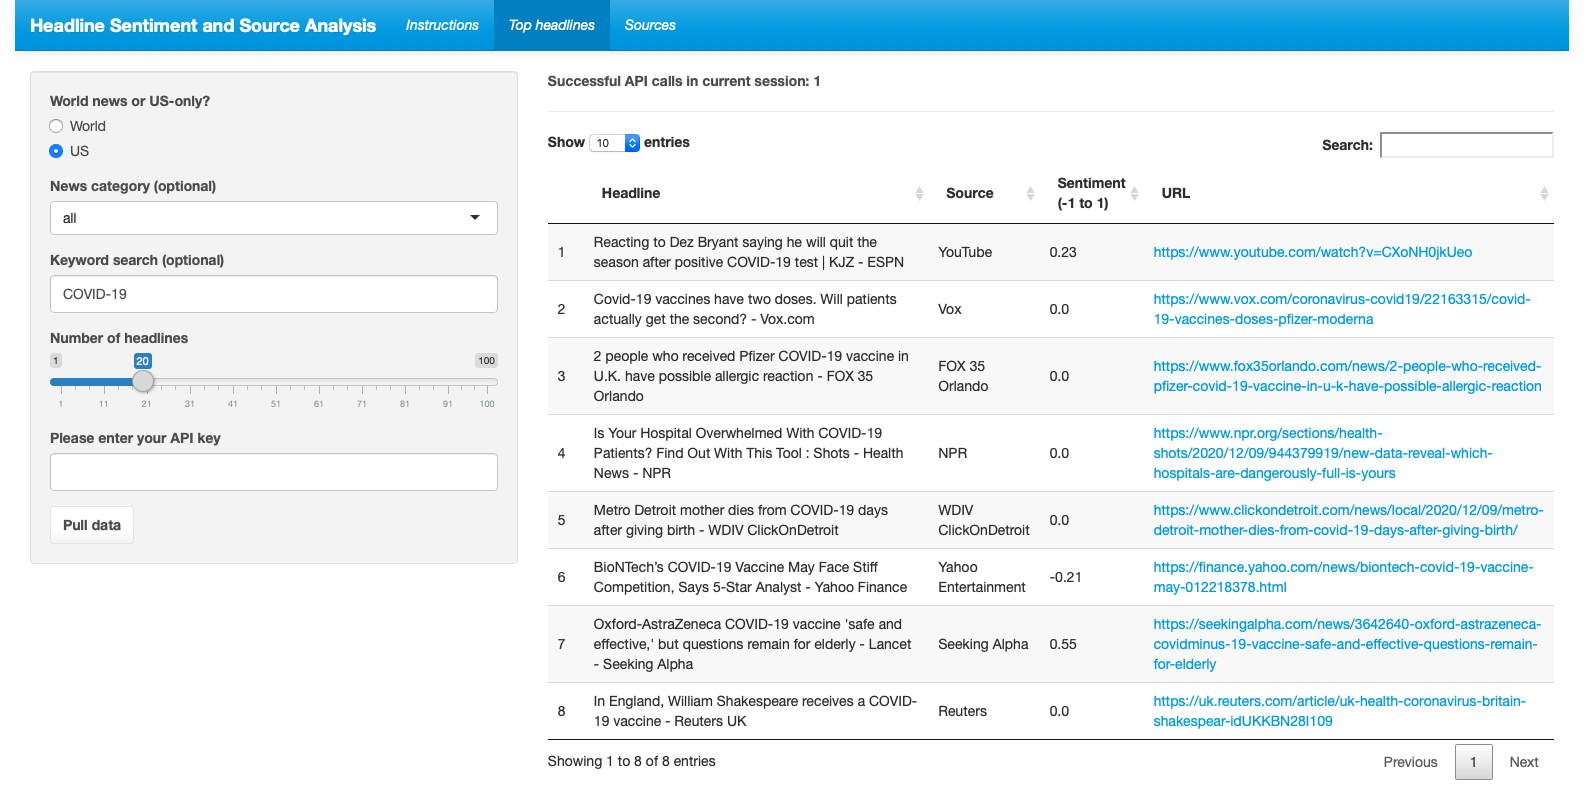
Shiny app that displays top headlines and news sources in tabular form based on user inputs
NYC Taxi Visualizations with Spark
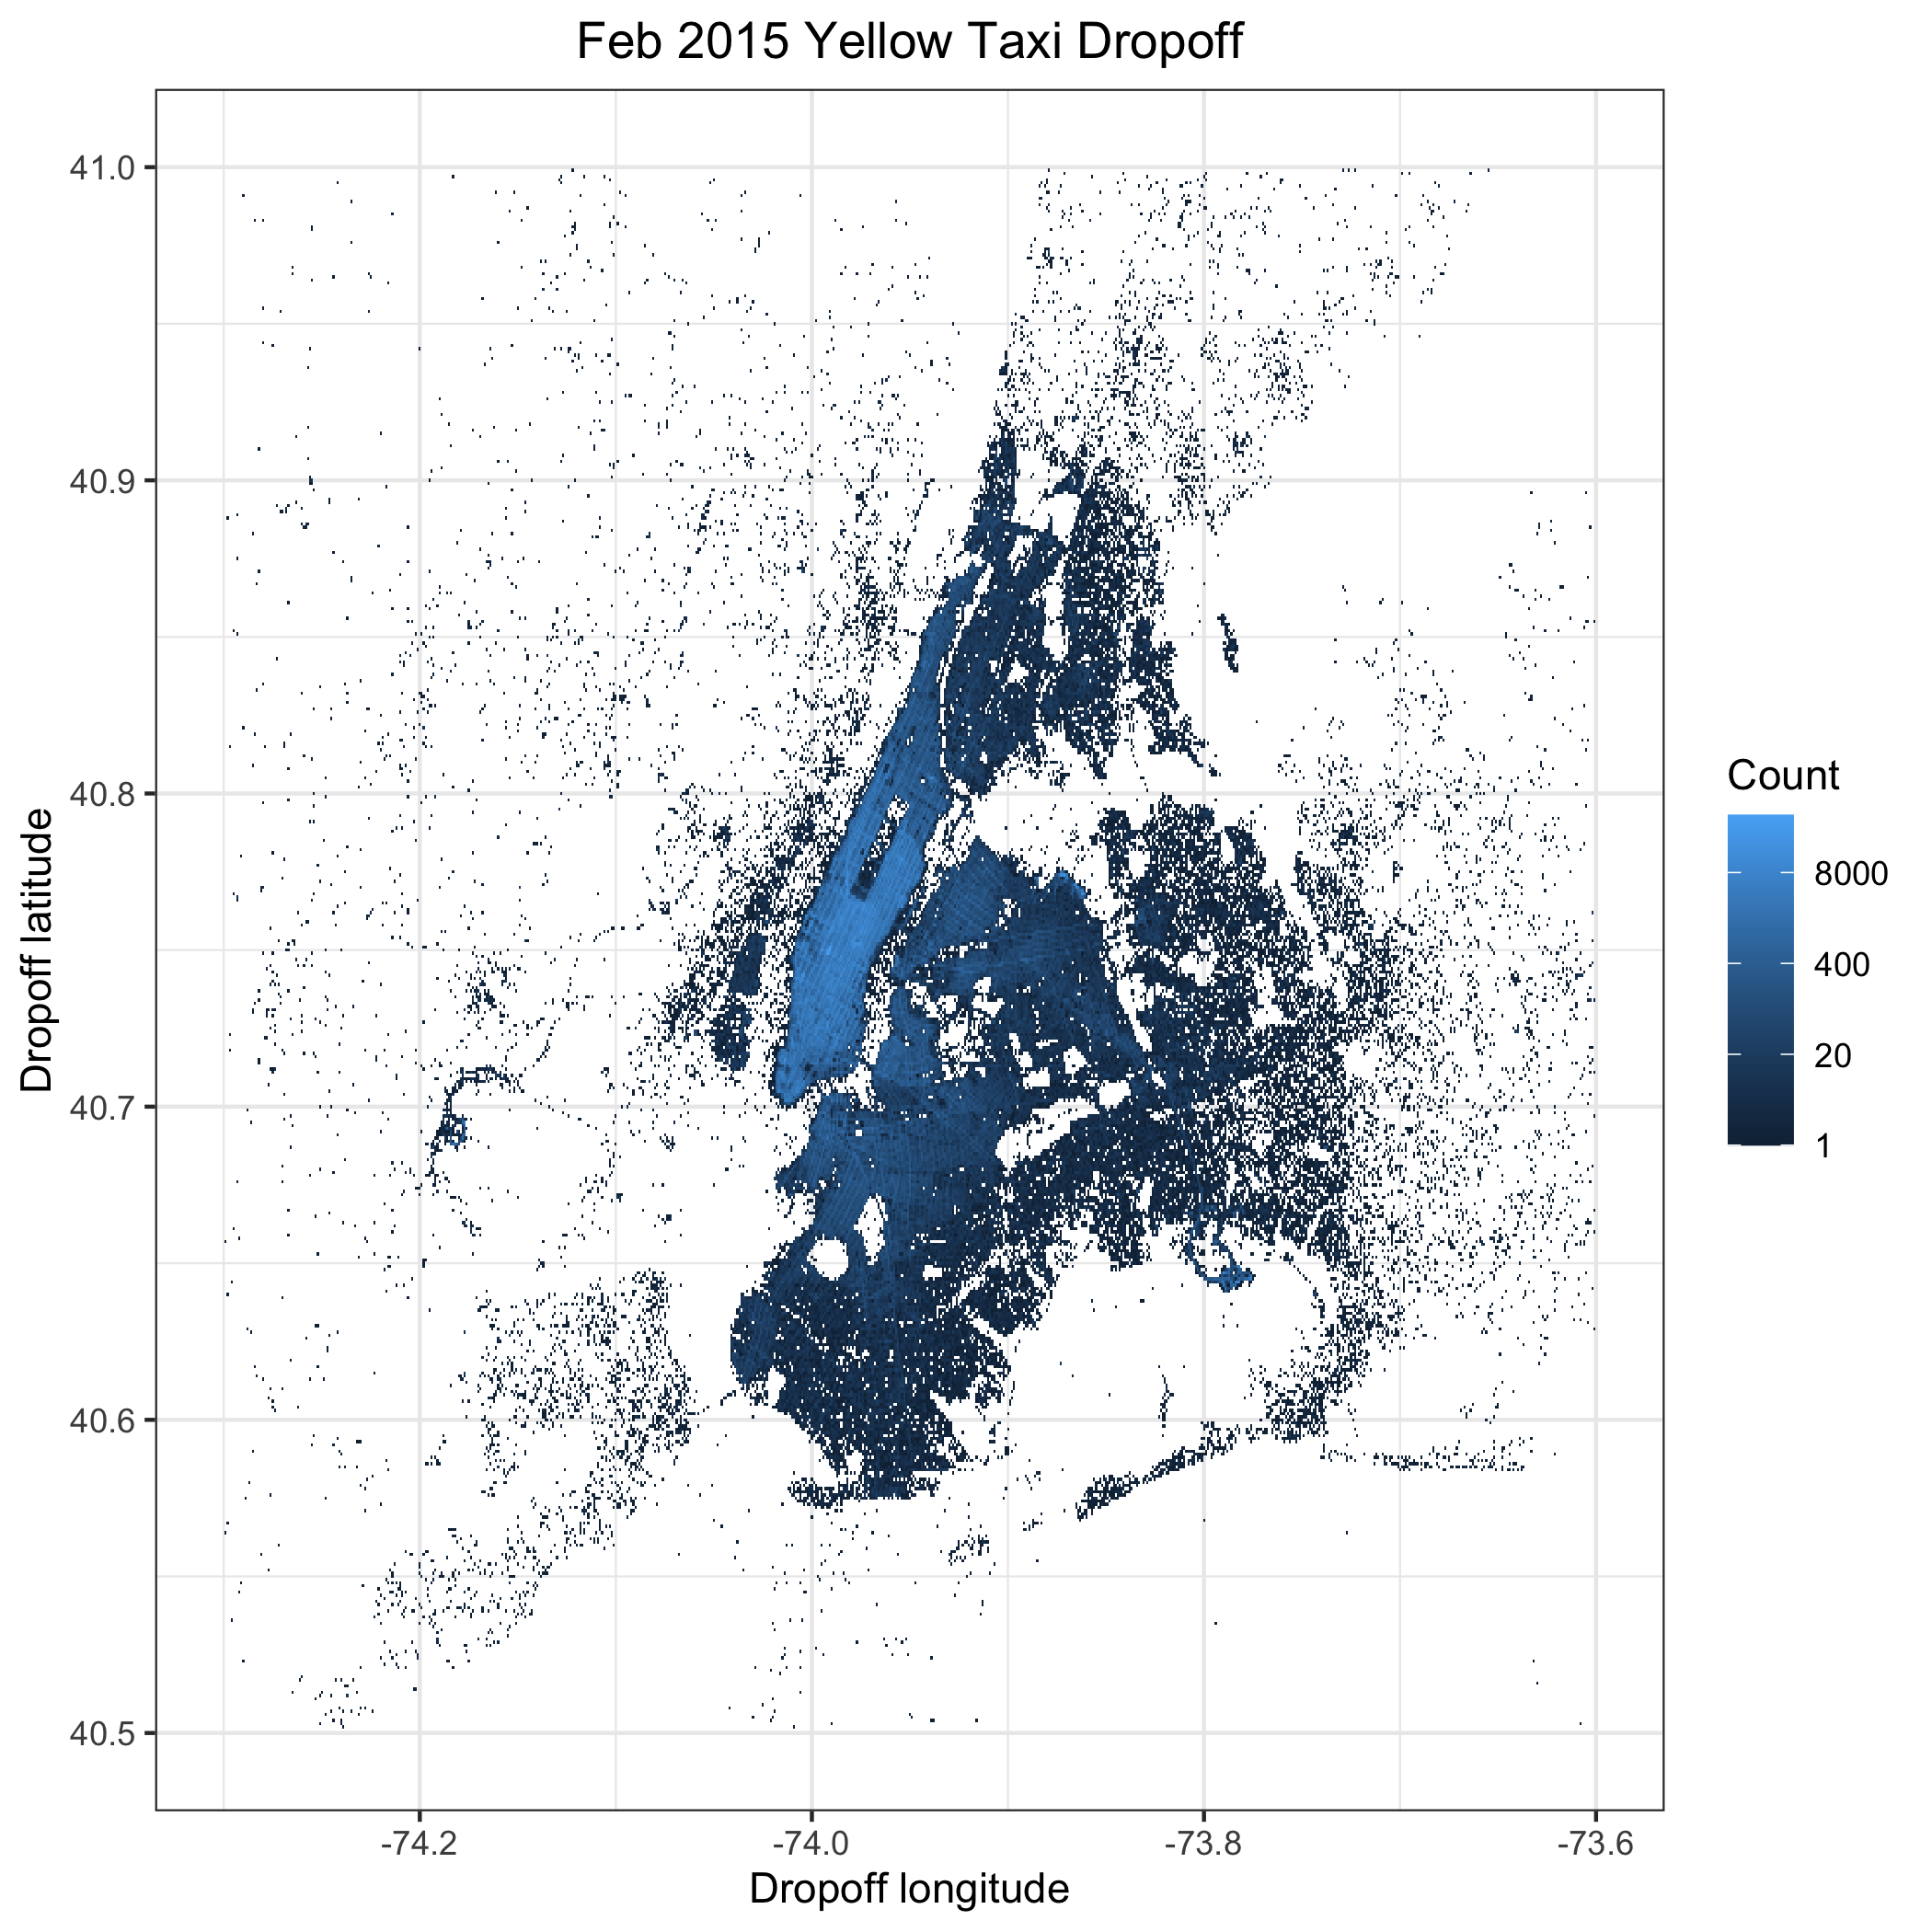
Analysis of February 2015 NYC taxi data. Primarily highlights advanced visualization techniques, use of Spark, and reproducible multi-step research processes
Blackjack Strategy Simulations with Parallel Processing

Assessment of different blackjack strategies through simulation, emphasizing efficiency through parallel processing and purposeful design of functions